
Slope Calculator
Given the coordinates of two different points on a line, this slope calculator can be used to find the slope and equation of the line. It also provides a diagram of the line, as well as determines the angle the line forms with respect to the x-axis. To use the calculator, please provide the coordinates of two different points and click the "Calculate" button.
What is slope?
The slope of a straight line is a measure of the steepness of the line. It is often described as  because it tells us how many units the line increases in the vertical direction (rise) over a given change in the horizontal direction (run).
The slope of a line can either be positive or negative. If the slope is 0, that means that the line is a horizontal line. If the slope is positive, then the line increases as it proceeds from left to right. If the slope is negative, then the line decreases as it proceeds from left to right.
Given two different points on a line, it is relatively simple to calculate the slope of the line using the slope formula.
Slope formula
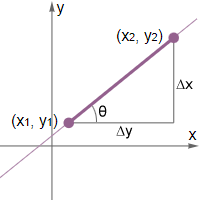
The slope formula is simply the change in y over the change in x:
| Slope = m = |
|
= |
|
Given two different points on a line, the change in y is calculated by subtracting the y-value of one point from the y-value of the other point. Similarly, subtract the x-value one point from the x-value of another. Note that it does not matter which value is subtracted from the other, as long as the points used are consistent for both y and x. For example, given the points (3, 1) and (2, 4), the slope of the line can be calculated as follows:
|
= |
|
= -3 |
or
|
= |
|
= -3 |
Notice that in either case, the result is the same. However, if we were to have subtracted 4 from 1, but then subtracted 3 from 2 instead in the first example, the slope would have been 3 rather than -3, which is incorrect.
How to find the slope of a line?
Finding the slope is relatively straightforward given two different points on a straight line, as shown in the example above. If we are instead given a graph of a line on a coordinate plane, simply pick two points on the line, then start at one point and count the number of units you need to move vertically and horizontally to get to the other point; the number of units in the vertical direction is the change in y, the number of units in the horizontal direction is the change in x, and the slope is the change in y over the change in x.
There are also other ways to find the slope. For example, there are a few different forms for the equation of a line, such as slope intercept form and point slope form. Slope intercept form takes the form
y = mx + b
while point slope form takes the form
(y - y1) = m(x - x1)
In both of these formulas, m represents the slope of the line. Thus, given an equation of a line, if we can convert the equation to either of the forms described above, we can simply read off m to determine the slope.
Slope-intercept form
Slope-intercept form is one of a number of forms that linear equations take. A linear equation in slope-intercept form takes the following form:
y = mx + b
where m is the slope and b is the y-intercept of the line. The y-intercept occurs at the point where the line crosses the y-axis. In other words, the y-intercept occurs at x = 0. The slope and the y-intercept can be any real number. Consider the following equation:
y = 2x + 7
In this linear equation, the slope of the line is 2, and the y-intercept occurs at (0, 7). Slope-intercept form is often used when introducing linear equations because it very quickly gives us information that we can use to graph the line. We know one point on the line, (0, 7), because the y-intercept is given. Thus, to graph the line, all we have to do is apply the slope formula. Since slope is  we know that for every 2 units that the line increases, it traverses 1 unit in the x direction. Knowing this allows us to count 2 units up from (0, 7) and one unit right, which lands us on the point (1, 9). Drawing a line between (0,7) and (1,9) therefore yields the graph of the straight line y = 2x + 7.